Beta software
ComPorter 64 bit
This is the beta version of the ‘old’ ComPorter which has been ported to a 64 bit version and compiled using Lazarus. The functionality is similar to the original version but includes the ability to add time stamps to the send or receive strings. This functionality means that when ComPorter is run on different computers sharing a serial link the latency of the serial messages can be easily tracked. Additionally strings can be echoed to the local terminal.
The intention is to keep the ‘on the fly’ terminal settings to make faster trouble shooting of serial connections. However this app has not been significanty tested in the field. Please feel free to download this app and let me know how it performs. The app makes use of an ini file to preserve state between sessions (unlike the older version that made use of the registry). One of the reasons for making the switch from the old version was to have cross platform compatability, so this version should also compile and run on Linux and MacOS.
see_sgy
see_sgy is a viewer for segy files. This uses the SegyIO Python libraries to access the binary data and header information. The back end is a Python script that uses the configparser module to set parameters using an ini file. The front end is a Windows 64 bit application that launches and edits the python script and associated ini file. The script is very fast and renders large segy files in only a few seconds. A screen shot of the GUI application is shown below:
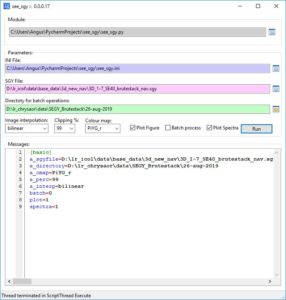
The application can be run as single file mode or in batch mode. The application automatically creates an image of the segy file in a sub folder called images in the directory where the segy files exist. There is no need to select the file parameters every time you launch the GUI application as “state” is remembered between sessions. An example image is shown below:
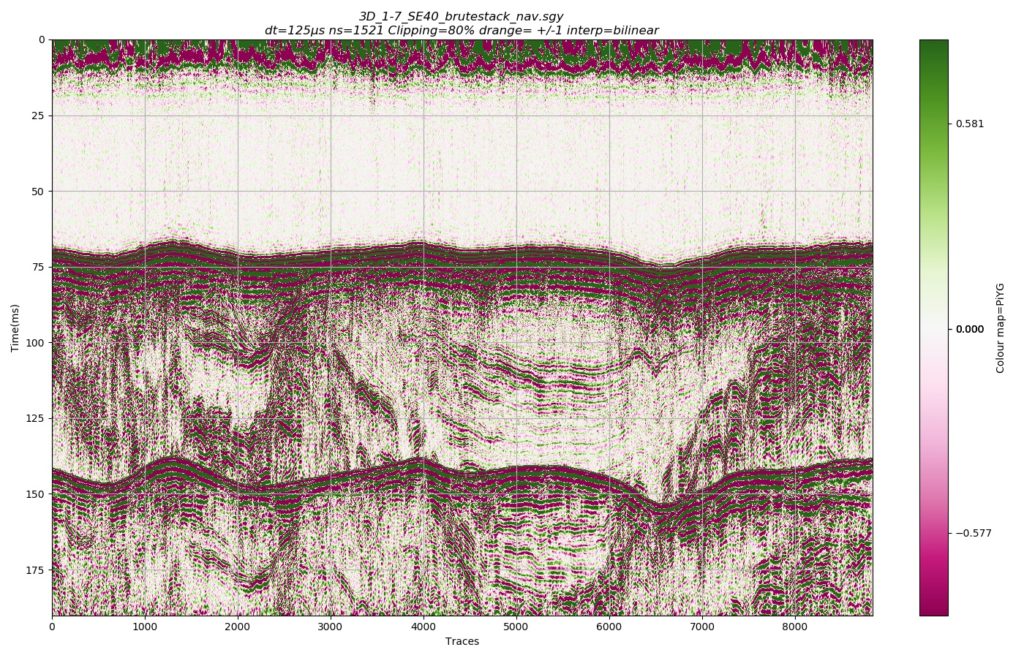
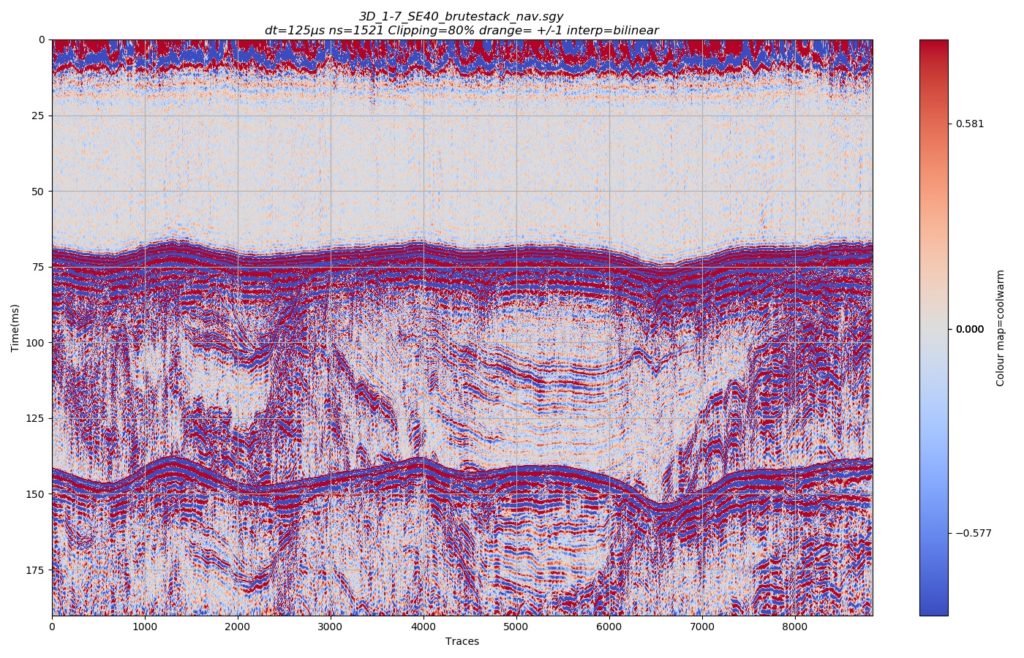
Image interpolation is supported by 17 different image interpolation algorithms and over 20 different colour maps. No changes are made to the segy file imaged; apparent gain is introduced by clipping the colour map to the data. In the example above a clipping of 80% has been applied to the colour map, changes to the clipping and other parameters are controlled by the GUI application, the same data rendered with a traditional “seismic” colour map is shown below:
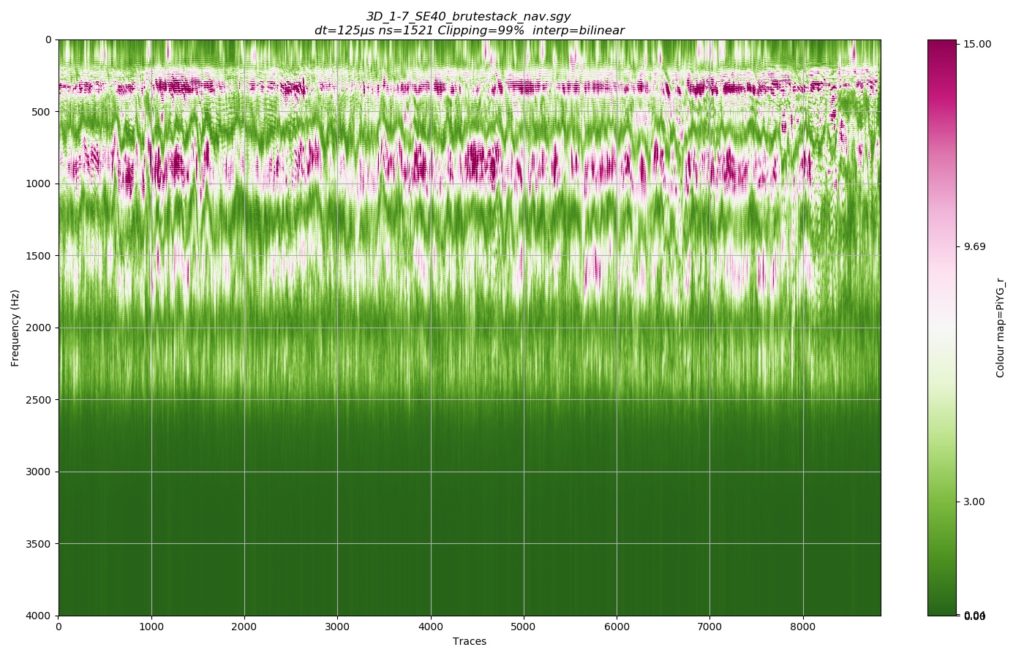
Below is an amplitude spectrum of the same line indicating the dominant frequencies are around 350Hz and 800Hz. The spectrum was calculated using the NumPy fundamental package for scientific computing with Python using the discrete Fourier transforms. The plots on this page were produced using Matplotlib.
Using the Mayavi 3D scientific visualisation and plotting libraries seismic volumes may be presented in a huge vumber of ways. This can give new insight into the quality of the data and the interpretation that may be derived. The images below are produced using the mlab API called from a python script.
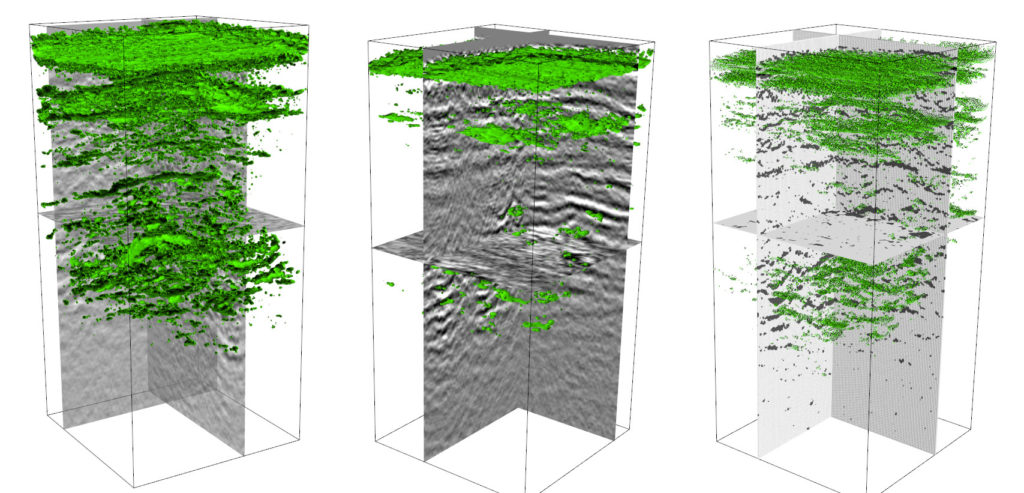
Using a 3D volume collected at the same site, and by using the Mayavi 3D scientific visualisation and plotting libraries the same volume can be rendered to produce the following video showing three image planes moving through the volume. The video is made by stacking images produced from API calls from a Python script.
