mag_xy
A magnetic processing, interpretation and reporting application
I originally came up with the concept of mag_xy as there seemed to be a dearth of magnetic processing utilities for single channel magnetic data in the marine environment. Commonly the marine magnetic data sets acquired were treated as “second class” and they were not interpreted well offshore (or indeed in the office).
mag_xy is a Windows 64bit application that is completely stand alone and will run on any version of 64bit Windows. It is designed to read magnetic data from a delimited text file (eg. from MagLog files) and produce an interpretation of the potential magnetic target almost on the fly. The processing algorithm used is based on the concepts described by S. Breiner of Geometrics in his classic publication ‘Applications Manual for Portable Magnetometers’. Benefits and limitations of this methodology are well discussed in this publication.
mag_xy performs a calculation that allows an estimate of the equivalent mass of iron that would produce an anomaly of a particular magnitude and half width; also a calculation is made to determine the likely depth of burial beneath the seabed.
mag_xy is based on the Python Mag_XY tool and has been ported to Wx64. It has been tested on W10. The concepts are the same as the python tool; however the results are written into a database back end that allows easy retrieval of the anomaly picks, dimensions, and screen shots of the anomalies themselves. The database is a single user portable database built using SqLite3. This means that the database can be passed between users and is not locked to one seat.
Database Connections

The database can be connected or disconnected. This is to allow the use of separate databases for different projects. If the user clicks on the button on the left the last used database will be opened by the app.

The button on the left allows the user to create a new empty database, such as 12345_ABC.db. The db extension is added automatically. The button on the right allows the user to connect to an existing database.
Load Magnetometer Data

Data is loaded into the app by loading a text file. The file must be delimited; any single character delimiter is supported including tabs. Fixed width columns may work using a space delimiter but this could be unpredictable. After selecting a text file the following dialog is shown:
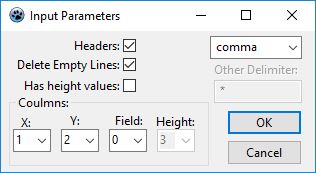
If the text file already has headers then these will be used, select the check box. An option exists to delete empty lines, select this check box if required. If there is height/altitude information in the file the check the “Has height values” check box, otherwise bottle heights can be added later. The dialog assumes that data will be used from a file that might contain many columns (eg. a MagLog file) this requires many fields.
Zooming with the mouse
Wheel only: Implements isotropic zooming. The graph is zoomed in or out in equal amounts.
Shift + Wheel: Zooming only occurs vertically.
Ctrl + Wheel: Zooming only occurs horizontally.
When used in conjunction with the pan tool this can make graph navigation very fast, compared to say Global Mapper that use button based zooming.
Anomaly measurement and management


These tools are mutually exclusive; you can select one OR the other. Select the left tool in the image, click on the graph with the left mouse bottom and drag the mouse. The tool provides a label indication how much has been measured.

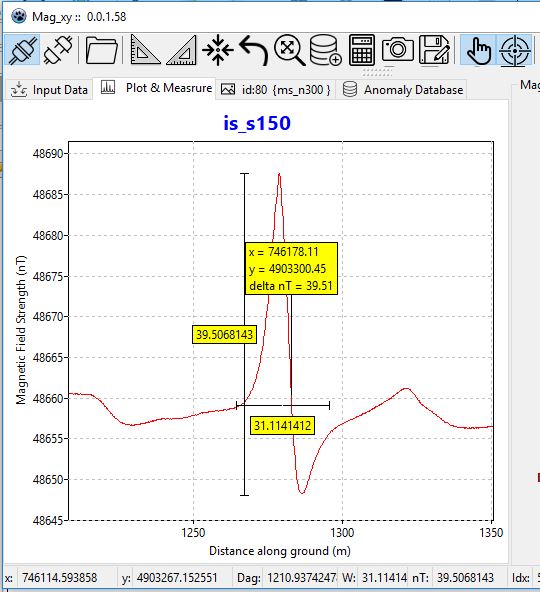
This tool is mutually exclusive with the above. Click the tool to activate it and then move the mouse to where you consider the center of the anomaly may be; click the graph. The graph should now look something like the image below:

To redo measurements and picks click on this button; the measurements are removed from the graph.

This tool is mutually exclusive with the above. Click the tool to activate it and then move the mouse to where you consider the centre of the anomaly may be; click the graph. The graph should now look something like the image below:
Adding an anomaly to the database & database navigation


To create a new record in the database click on the insert record button. A new blank record in inserted with a unique id.

To put the anomaly measurements into this record click on the database add button. The fields in the main app are populated with the anomaly values.

Click on the ‘post’ button and the anomaly values are pushed into the database.

The first, prior, next, and last buttons will navigate through the database either one record at a time or to the first record or last record, depending upon which button is pushed.
The anomaly calculator tool

The anomaly calculator button brings up the anomaly calculator window, in which the equivalent mass of iron and the depth of the anomaly is calculated. This calculation depends upon the width of the anomaly, the magnitude of the magnetic field delta of the anomaly, and the characteristic shape of the anomaly (monopole or dipole). The window calculates as you type into the edit boxes, or change the anomaly type. This window also allows you to enter a bottle altitude above sea bed if this parameter was not in the imported text file. Pressing the OK button populates the fields in the right hand pane. After this has been done it will be necessary to post the data to the database using the post tool.
Image tools

The snapshot tool (left) may be used to make a jpg copy of the graph and save it to the database as a blob field. This means that the images are stored in the database for future use. When the snapshot tool is pressed not only is an image of the graph stored in the database but a copy is copied to the clipboard for immediate use. The image save tool (right) saves a copy of the image stored in the database as a jpg file. This may be useful as images may be stored in the database during analysis for inclusion into reports at a later date. The file name used by this tool results in a unique name that links the record id and the original text file name.
Graph helper tools

Enabling the pan tool (left) allows you to pan with the right hand mouse key. Enabling the cross hair tool (right) allows a cross hair to snap to the closest data point to the mouse cursor as the cursor gets close to a data point.
Persistence
In an attempt to make the use of the app a positive experience use has been made of persistence. Most GUI elements “remember” their state between instances of the app. So, for example, the import file settings only have to be set once for a particular file format rather than every time the file is loaded. These values are stored in the file mag_xy.xlm in the same directory as the executable. If these files are deleted they should be recreated automatically by the app. mag_xy make no use of the Windows registry.
Export of database to xlsx and csv files
During normal operation of the database the app routinely makes an export of itself (without the stored images) to the root of the executable. To force the database to export the latest version of itself to CSV format hide and then make visible the “Anomaly sheet” tab sheet. A CSV file with the same name as the database will be created (eg. 12345_ABC.csv).
A fully compliant xlsx file can be created by using the export to file button. Default colours can conform to a standard document template and can be set at any time. Pressing the button will cause the export dialog box to appear.
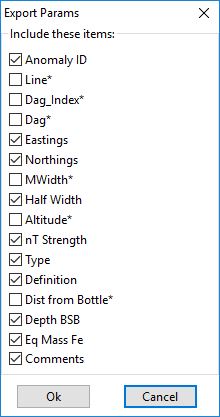
Check the boxes to determine which columns will appear in the xlsx sheet. Depending upon the reporting cycle it may not be appropriate to provide all the interpreted data; it may not be appropriate to include anomaly half width and estimated equivalent mass of iron in the field report. Check boxes with an asterisk after their name are columns that are used in the calculations but would not normally be given to a client at all, however these may be of interest during a interpretation stage.
Note: Images are not yet exported but can me manually exported. Pressing the Ok button will cause the xlsx file to be generated, you may save this file to a location of your choice. Only minor adjustment of the table in the Excel file should be required for copy/paste into Word
Dockable tool bar
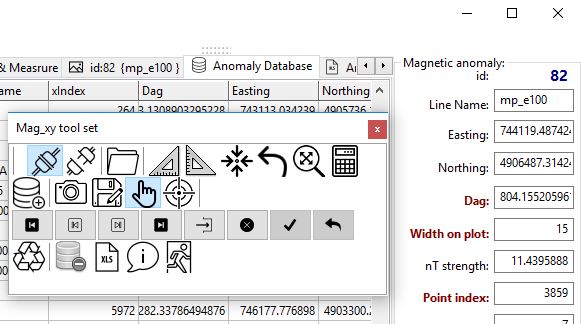
The tool bar contains all the tools available to the user. Hover over a tool button and a tool tip will appear that should give an indication as to its use. Depending upon the screen size you are using you may want to make more screen “real estate” available. When there is not much space you may consider un-docking the toolbar from the app and put it somewhere else. The toolbar can be re-docked by placing it near the top of the app with the left hand mouse button.
Settings Button
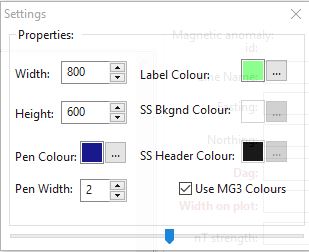
Clicking on the setting button shows a dialog where various items can be configured. The dialog has been designed so that changes are immediately reflected by the app. All the settings are stored between instances of the app, so settings are ‘remembered’ between sessions.
The settings dialog allows the appearance of the graph to be altered. The size may be changed ‘on the fly’ so that if greater detail is required for a copy to clipboard operation then the graph may be increased in size using the width and height spin edit controls. Similarly the pen colour, pen width, and anomaly label colours may be altered or set using this form. Additionally this form gives some control over the exported XLSX file in as much as the header may be configured either to have default “house colours” or a customised version that the user selects.
The form also has a slider at the bottom that allows the transparency of the form to be changed on the fly, setting the transparency may make using the form easier on the eye.
Time Limited Licencing
The app now has included a licence file (mag_xy.lic) that contains a time limitation. If you want more time to use the app then contact me and I will issue another licence file via email. The licence file contains encrypted hashes, any edits to the Ecodes section will be detected by the app, and the app will revert to demo mode.
